HIGHLIGHTS
- Policymakers and members of the public depend on timely and user-friendly GHGRP data from EPA.
- Abt developed an efficient process to develop and update interactive visualizations.
- Improved understanding of emission sources can inform reduction strategies.
The Challenge
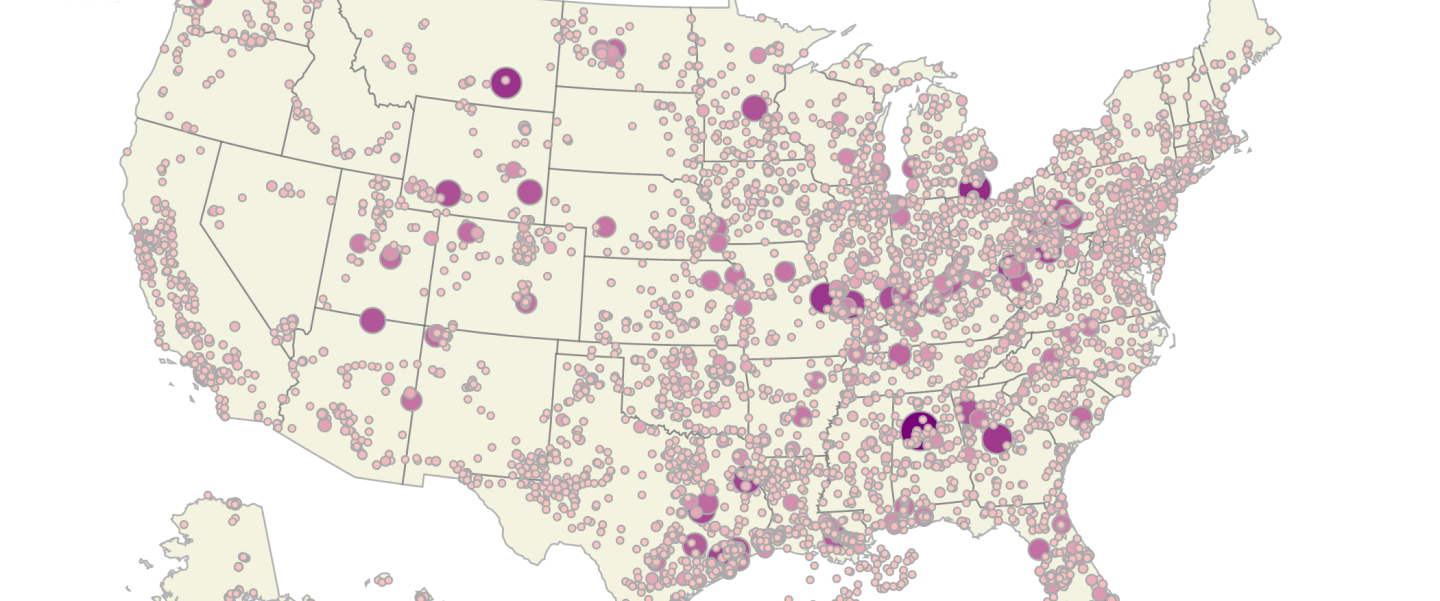
The Environmental Protection Agency (EPA) has been collecting greenhouse gas emissions data through the Greenhouse Gas Reporting Program (GHGRP) from approximately 8,000 emitters—including power plants, oil and gas producers, and manufacturers—since 2010. The data provides important information that is used by policymakers and the public to better understand the sources and types of GHG emissions at facilities, and can inform emissions reduction strategies. EPA turned to Abt Global to help provide annual user-friendly, interactive data visualizations and summaries.
The Approach
Abt used a two-fold approach of improving the annual GHGRP Data Highlights user experience by making the content more interactive, and automating and streamlining the annual data update process. The entire GHGRP Data Highlights workflow is now optimized, using Qlik Sense® to generate embedded and interactive charts and graphs on EPA’s webpages, and R Markdown to automatically update industrial sector profile documents.
The Results
Abt’s changes to GHGRP Data Highlights resulted in users spending an average of 50 percent more time on pages with updated interactive content. Additionally, by optimizing and streamlining the processes for generating its annual data publication materials, EPA can spend more resources on improving the existing content and developing new resources for GHGRP data users. For example, Abt recently developed a new interactive resource for obtaining state-specific GHG emissions information and data. By providing interactive and user-friendly GHGRP publication materials, stakeholders are better able to understand facility-level GHG emissions and inform approaches to estimating and reducing GHG emissions.
